Open Business Intelligence
Premium
Contact
About
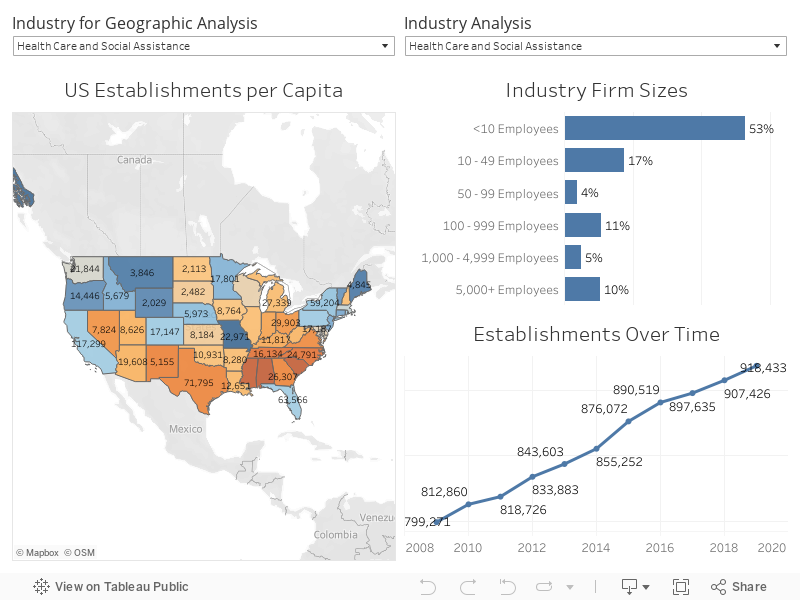
The visualizations were created using USA census data from 2008 - 2019
(Source)
.